


Vous vous essayer à travailler sur des images avec scipy ou NumPy, ou encore à tracer des courbes mathématiques, mais est-il possible d’utiliser Dynamo pour cela ?.
Tant qu'à modifier/afficher des images, autant pouvoir les afficher et les réutiliser directement dans Dynamo sans avoir à sauvegarder le fichier image pour pouvoir le réimporter ensuite via une lecture.
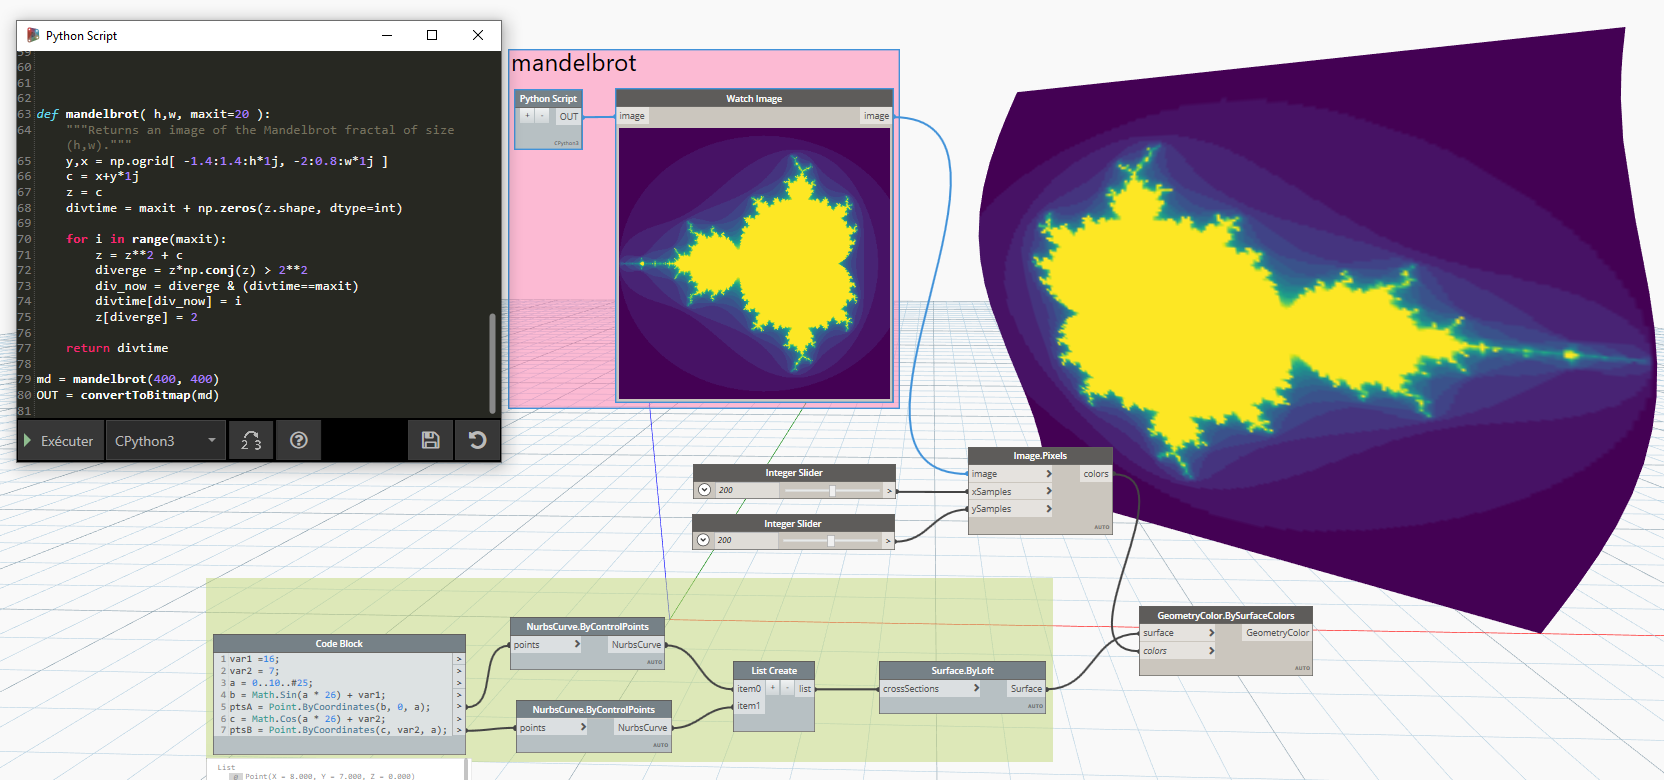
Voici donc une astuce pour convertir une image au format ndarray en Bitmap (Net framework) avec le moteur CPython3/PythonNet.
Note:
pour les tableaux a 3 dimensions on utilise les couleurs RGB contenus dans
celui-ci, pour les tableaux a 2 dimensions on passe par une interpolation de
couleur avec une palette de couleur de la librairie matplotlib- un exemple avec une image inclue dans scipy
# Charger les bibliothèques DesignScript et Standard Python
import sys
import clr
import System
clr.AddReference('ProtoGeometry')
from Autodesk.DesignScript.Geometry import *
sys.path.append(r'C:\Users\sneep\AppData\Local\python-3.8.3-embed-amd64\Lib\site-packages')
import System
clr.AddReference('System.Drawing')
import System.Drawing

from System.Drawing import *
from System.Drawing.Imaging import *

import numpy as np
from scipy import misc
from matplotlib import cm
from matplotlib import colors as mcolors
face = misc.face() #ndarray 3 dimmensions
face2dG = misc.face(gray = True) #ndarray 2 dimmensions


def getRGBfromPalette(npArr, colorMapName):
    """ create a palette color from max value in ndarray """
    color_map = cm.get_cmap(colorMapName)
    a_max = np.amax(npArr)
    palettNp = color_map(np.linspace(0, 1, a_max + 1))
    palettRGB = [(r * 255, g * 255, b * 255) for r,g,b,a in palettNp]
    return palettRGB

def convertToBitmap(npImgArray, colorMapNamefor2D = 'viridis'):
    """ create Bitmap from ndarray image """
    palettRGBfor2D = getRGBfromPalette(npImgArray, colorMapNamefor2D)
    bmpOut = Bitmap(npImgArray.shape[1], npImgArray.shape[0])
    for i in range(npImgArray.shape[1]):
        for j in range(npImgArray.shape[0]):
            if npImgArray.ndim == 3:
                subnpArray = npImgArray[j][i]
                bmpOut.SetPixel(i, j, Color.FromArgb(subnpArray[0], subnpArray[1], subnpArray[2]))
            #
            elif npImgArray.ndim == 2:
                subnpArray = npImgArray[j][i]
                r, g, b = palettRGBfor2D[subnpArray]
                bmpOut.SetPixel(i, j, Color.FromArgb(r, g, b))
            #
            else:
                pass

    return bmpOut


OUT = convertToBitmap(face), convertToBitmap(face2dG, colorMapNamefor2D = 'gray'), convertToBitmap(face2dG, colorMapNamefor2D = 'inferno')

- un autre exemple avec le tracé d'une courbe mathématique
# Charger les bibliothèques DesignScript et Standard Python
import sys
import clr
import System
clr.AddReference('ProtoGeometry')
from Autodesk.DesignScript.Geometry import *
sys.path.append(r'C:\Users\sneep\AppData\Local\python-3.8.3-embed-amd64\Lib\site-packages')
import System
clr.AddReference('System.Drawing')
import System.Drawing

from System.Drawing import *
from System.Drawing.Imaging import *

import numpy as np
from scipy import misc
from matplotlib import cm
from matplotlib import colors as mcolors
import matplotlib.pyplot as plt


def plt2arr(fig, draw=True):
    """
    need to draw if figure is not drawn yet
    """
    if draw:
        fig.canvas.draw()
    rgba_buf = fig.canvas.buffer_rgba()
    (w,h) = fig.canvas.get_width_height()
    rgba_arr = np.frombuffer(rgba_buf, dtype=np.uint8).reshape((h,w,4))
    return rgba_arr

def getRGBfromPalette(npArr, colorMapName):
    """ create a palette color from max value in ndarray """
    color_map = cm.get_cmap(colorMapName)
    a_max = np.amax(npArr)
    palettNp = color_map(np.linspace(0, 1, a_max + 1))
    palettRGB = [(r * 255, g * 255, b * 255) for r,g,b,a in palettNp]
    return palettRGB

def convertToBitmap(npImgArray, colorMapNamefor2D = 'viridis'):
    """ create Bitmap from ndarray image """
    palettRGBfor2D = getRGBfromPalette(npImgArray, colorMapNamefor2D)
    bmpOut = Bitmap(npImgArray.shape[1], npImgArray.shape[0])
    for i in range(npImgArray.shape[1]):
        for j in range(npImgArray.shape[0]):
            if npImgArray.ndim == 3:
                subnpArray = npImgArray[j][i]
                bmpOut.SetPixel(i, j, Color.FromArgb(subnpArray[0], subnpArray[1], subnpArray[2]))
            #
            elif npImgArray.ndim == 2:
                subnpArray = npImgArray[j][i]
                r, g, b = palettRGBfor2D[subnpArray]
                bmpOut.SetPixel(i, j, Color.FromArgb(r, g, b))
            #
            else:
                pass

    return bmpOut


# plot sin wave
fig = plt.figure()
ax = fig.add_subplot(111)
x = np.linspace(-np.pi, np.pi)

ax.set_xlim(-np.pi, np.pi)
ax.set_xlabel("x")
ax.set_ylabel("y")
ax.plot(x, np.sin(x), label="sin")
ax.legend()
ax.set_title("sin(x)")

fig.canvas.draw()

image_from_plot = plt2arr(fig)

OUT = convertToBitmap(image_from_plot)

-
Autre Méthode plus rapide (conversion BytesArray via PIL)
import sys
import clr
import System

clr.AddReference('System.Drawing')
import System.Drawing
from System.Drawing import Bitmap
from System.IO import MemoryStream

import numpy as np
import matplotlib.pyplot as plt
from PIL import Image
import io
import pandas as pd
from scipy import misc
face = misc.face() #ndarray 3 dimmensions
face2dG = misc.face(gray = True) #ndarray 2 dimmensions

def plt2arr(fig):
    """
    need to draw if figure is not drawn yet
    """
    fig.canvas.draw()
    rgba_buf = fig.canvas.buffer_rgba()
    (w,h) = fig.canvas.get_width_height()
    rgba_arr = np.frombuffer(rgba_buf, dtype=np.uint8).reshape((h,w,4))
    return rgba_arr

def convertToBitmap2(npImgArray):
    bitmap_ = None
    # remove alpha
    if npImgArray.ndim == 3 and npImgArray.shape[-1] == 4:
        npImgArray = npImgArray[:, :, :-1]
    # convert to PIL Image
    if npImgArray.ndim == 3:
        image = Image.fromarray(npImgArray, "RGB")
    else:
        image = Image.fromarray(npImgArray, "L")
    # convert to Python ByteArray
    byteIO = io.BytesIO()
    image.save(byteIO, format='BMP')
    byteArr = byteIO.getvalue()
    # convert to Net ByteArray
    netBytes = System.Array[System.Byte](byteArr)
    with MemoryStream(netBytes) as ms:
        bitmap_ = Bitmap(ms)
    return bitmap_

# Example 1 : plot sin and cos wave
fig = plt.figure()
ax = fig.add_subplot(111)
x = np.linspace(-np.pi, np.pi)
ax.set_xlim(-np.pi, np.pi)
ax.set_xlabel("x")
ax.set_ylabel("y")
ax.plot(x, np.sin(x), label="sin")
ax.plot(x, np.cos(x), label="cos")
ax.legend()
ax.set_title("sin(x) and cos(x)")
img_sin_cos = plt2arr(fig)
bitmap1 = convertToBitmap2(img_sin_cos)
#
# Example 2 : convert img scipy
bitmap2 = convertToBitmap2(face)
bitmap3 = convertToBitmap2(face2dG)
#
# Example 3 : plot a Dataframe
file_name = "https://raw.githubusercontent.com/uiuc-cse/data-fa14/gh-pages/data/iris.csv"
df_iris = pd.read_csv(file_name)
# ax = df_iris.plot(kind="scatter", x="sepal_length", y="sepal_width", figsize=(10, 8)
ax = df_iris.plot(kind="scatter", x="sepal_length", y="sepal_width")
img_iris = plt2arr(ax.get_figure())
bitmap4 = convertToBitmap2(img_iris)
#
OUT = bitmap1, bitmap2, bitmap3, bitmap4


0 commentaires:
Enregistrer un commentaire